Evolution of the Magnetic Field in High- and Low-β Disks with Initially Toroidal Fields
Can a weak toroidal field generate a strong poloidal field?
In 1977, Roger Blandford and Roman Znajek proposed a mechanism by which relativistic jets could be launched through an interaction between a strong poloidal magnetic field and a spinning black hole. While this theory is the most widely accepted method of jet launching today, it is difficult to verify through observation as all known supermassive black holes in the Universe (including our own, SgrA*) are too far away for high resolution studies of the magnetic field’s shape. Instead, much of what we know about the flow of material around a black hole and jet launching comes from simulations.
Simulations are an imperfect recreation of reality, though, and we are limited by computer power and human time and cost. The more complex physics you ask a simulation to solve, and the higher the resolution, the longer it takes. And when computational time costs real human dollars, there’s only one solution: simplify. One of the biggest challenges as a simulator is to know when and where you can simplify things, and to what degree, before your results start to become really unphysical.
One common simplification in accretion disks is to start the simulation with a magnetic field that already has some vertical component, and to make this magnetic field relatively strong. If we assume that the simulation eventually forgets its initial conditions, then this is a great simplification: we get to the same result in much faster time. But does the assumption hold?
In this project, we wanted to test whether a simulation initialised with a (weak or strong) toroidal field would
a. produce the strong poloidal field needed for jets, and
b. match simulations initialised with a poloidal or other vertical component field.
If (a) failed, this would indicate that the simulations were missing some as-of-yet-unknown physics to describe magnetic field evolution. If (b) failed, it would indicate that the simulations do not forget their initial magnetic conditions, and hence we would need to think very carefully about what a “realistic” initial condition for a disk is out in the Universe, which would inevitably bring up even more difficult questions like “how does a disk form?”.
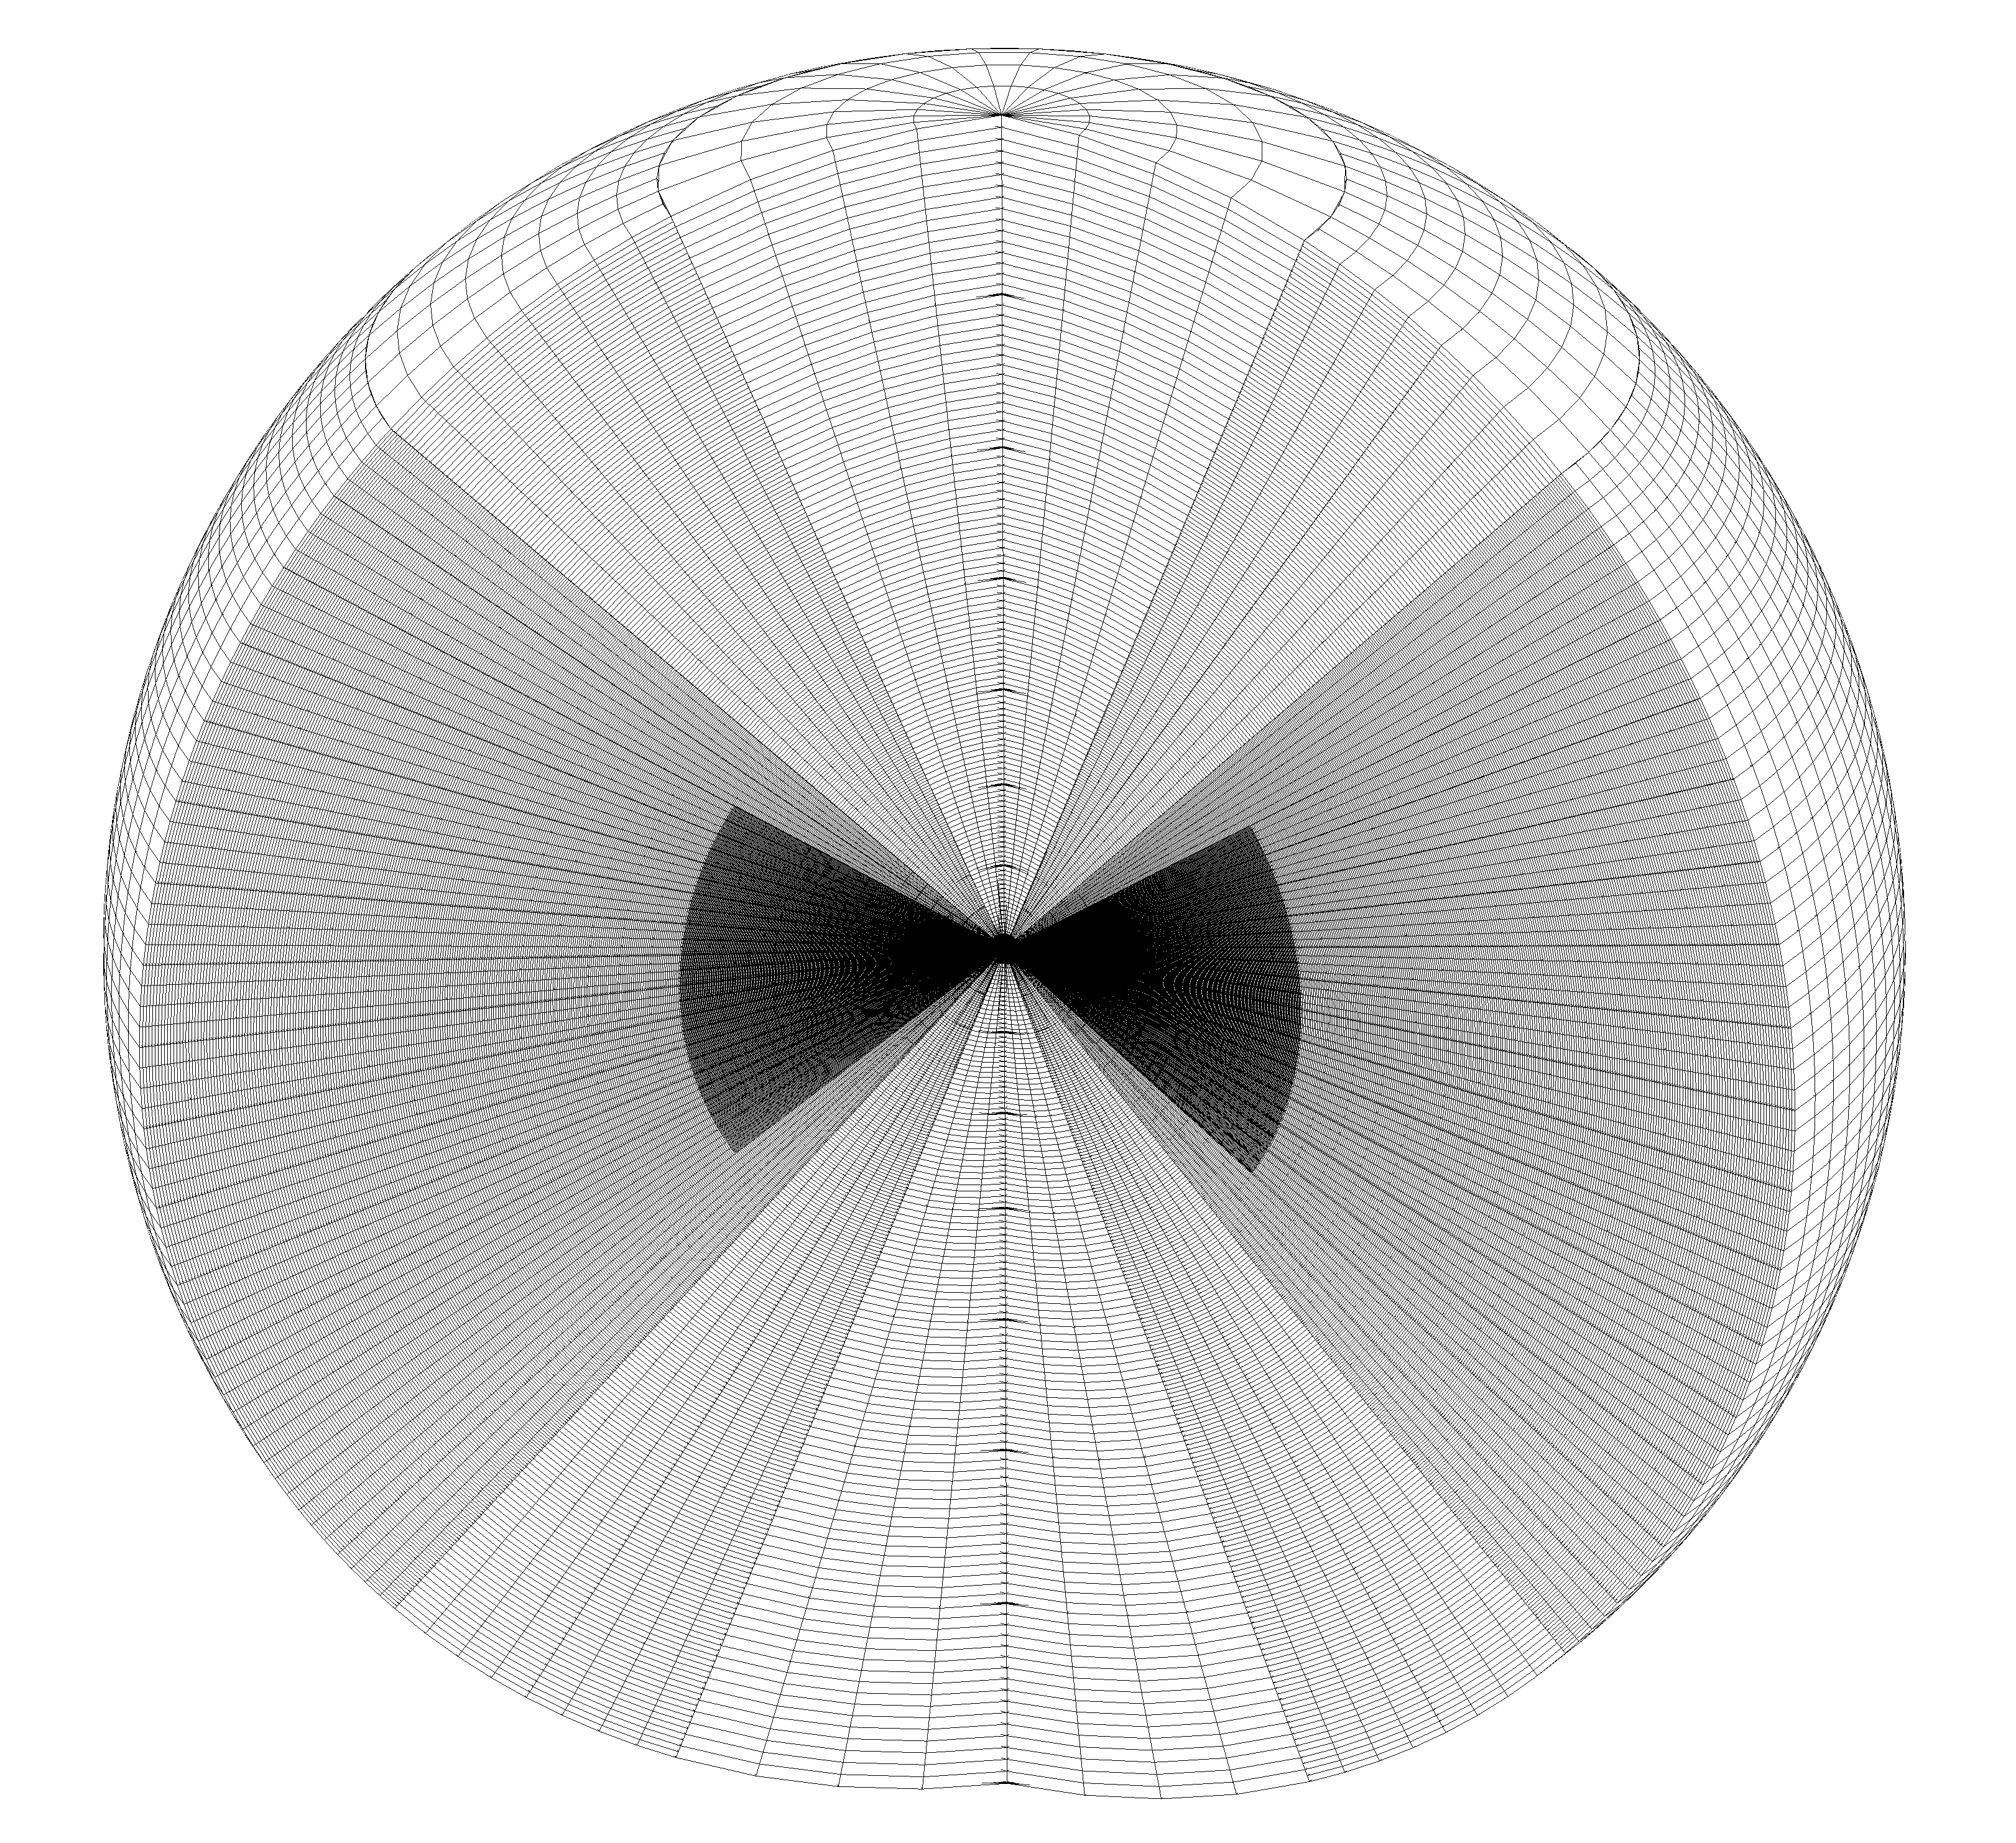
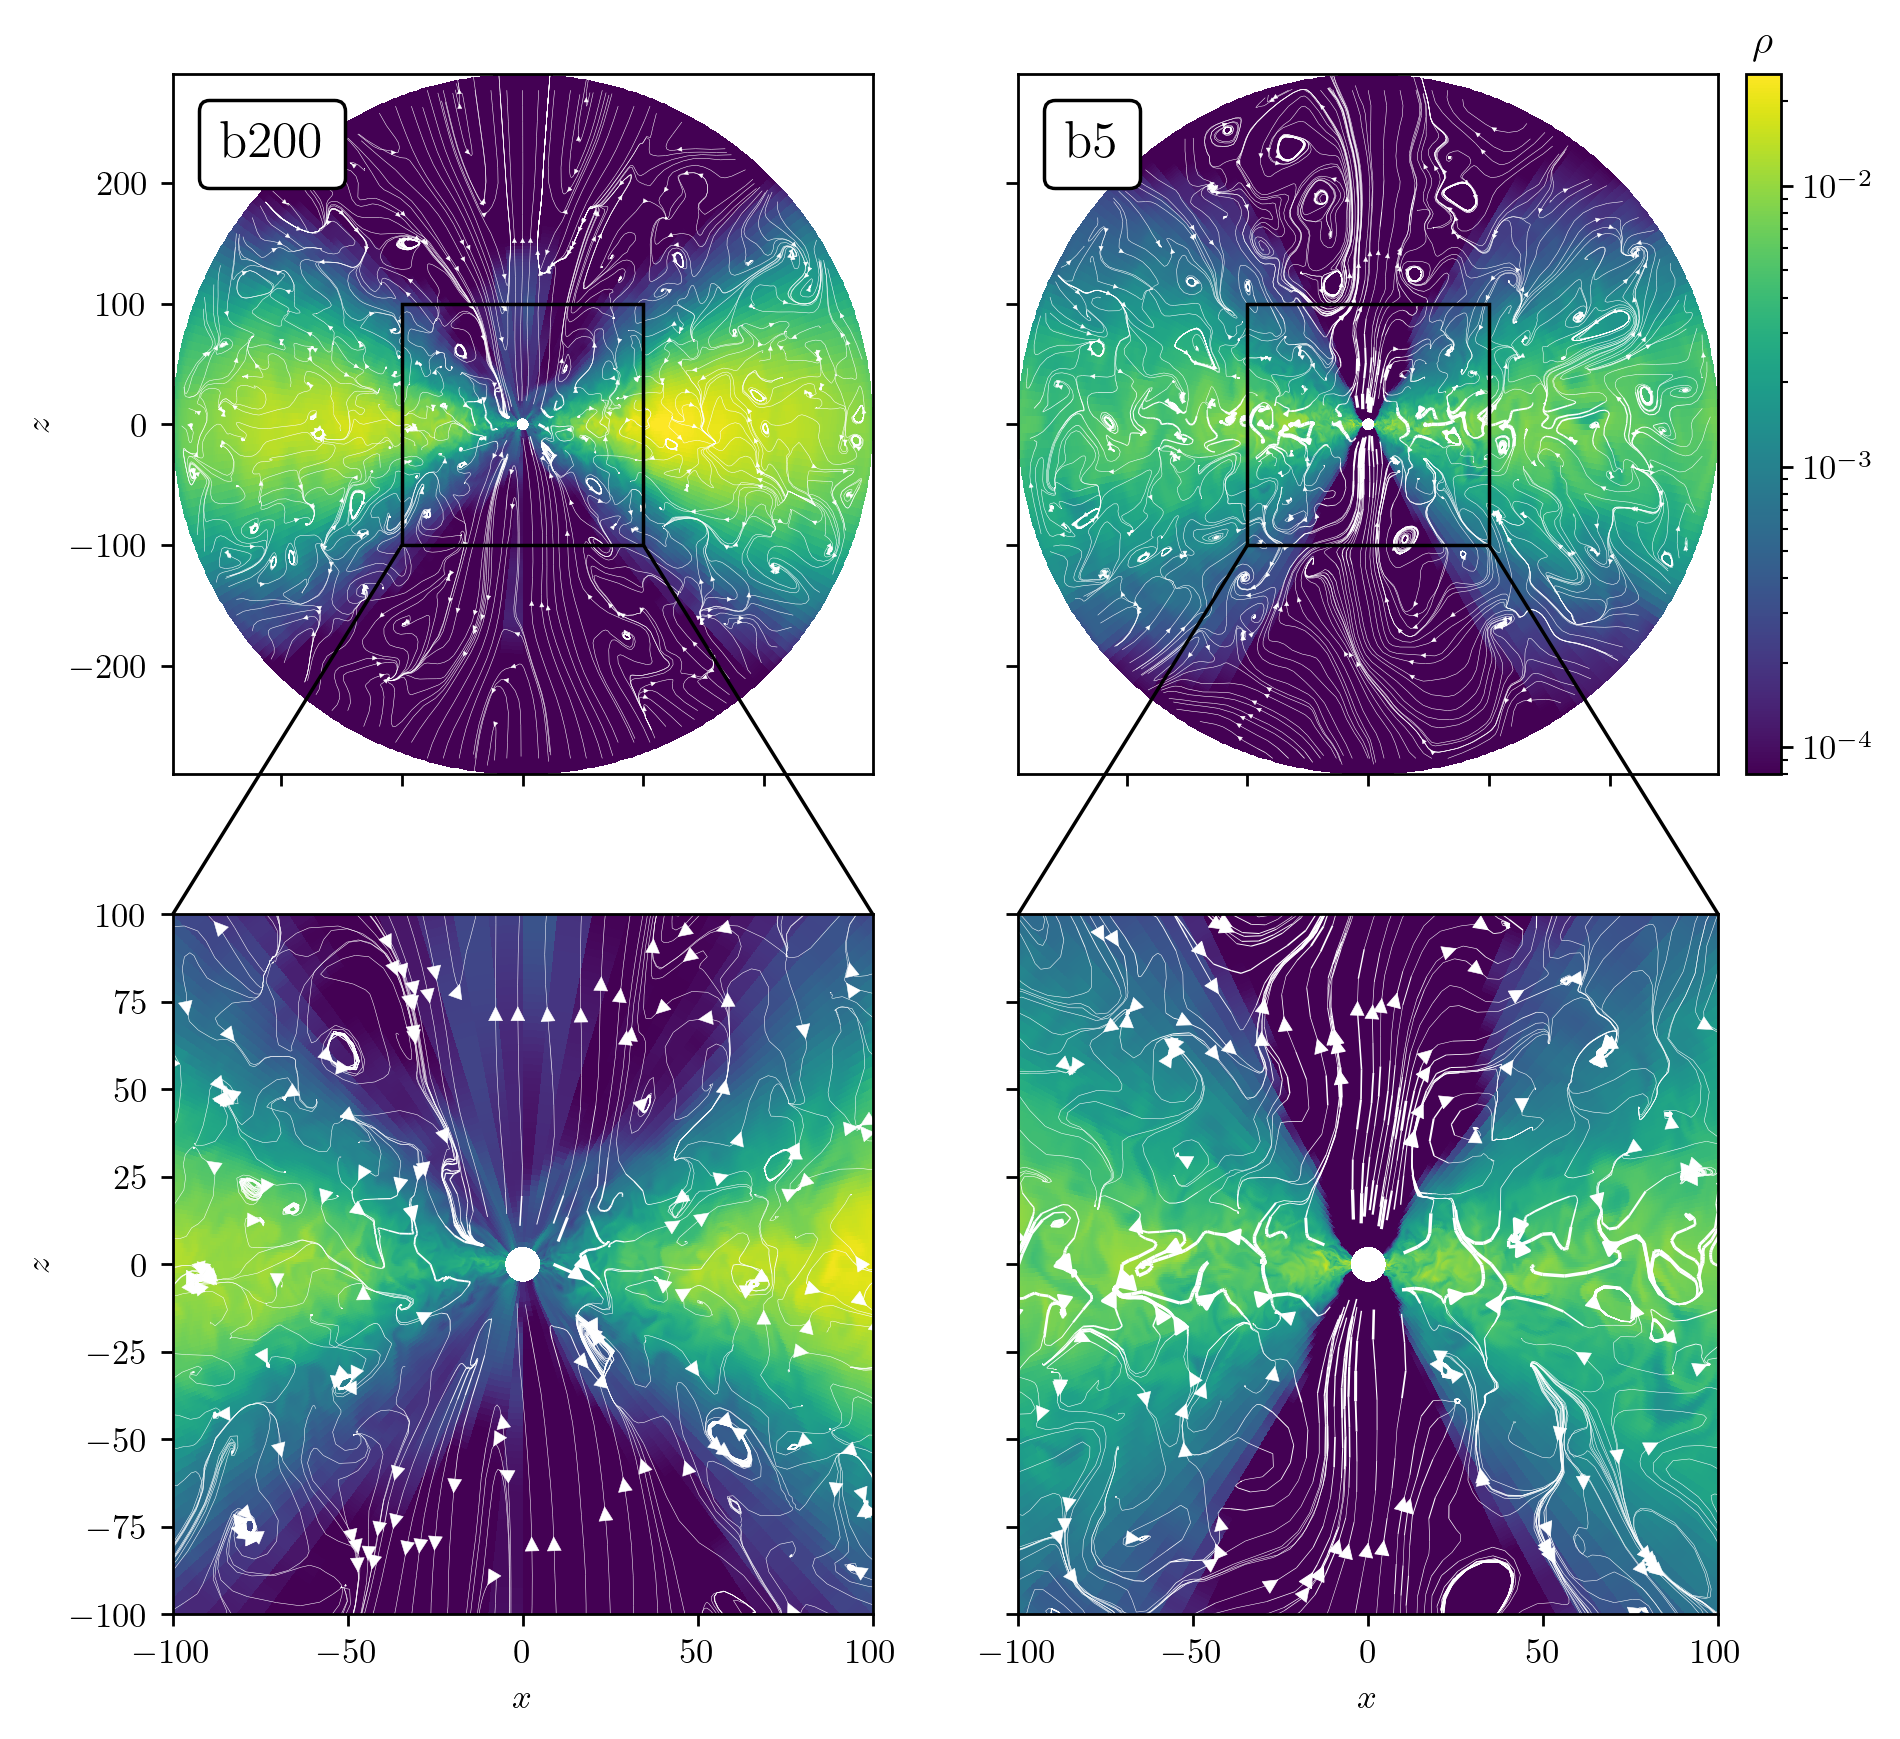
To test these two statements, we ran two simulations of accretion disks with initially toroidal fields, one with a weak field (plasma beta $\beta=P_{\rm mag}/P_{\rm gas}=200$) and the other with a strong field ($\beta=5$, similar to the literature). To assess the effect of resolution, we ran each simulation at two resolutions, $(896\times256\times256)$ and $(896\times512\times512)$. Each simulation was run until it had converged on some “stable” state. We then compared our simulations to each other and to the literature.
We found:
The simulations diverged early on and remained on distinct evolutionary paths for the duration of their runs. The weak and strong field simulations did not converge to give similar results, even at high resolution. They retained memory of their initial field strength.
The strong-field disk showed some evidence of a large-scale poloidal field at both resolutions. The weak-field disk did not.
Our weak-field disk with lower resolution developed an overdensity or “lump” early on in the simulation which persisted until the end. It appears at radius $r=100r_g$, where the resolution of the simulation decreases, indicating that this is an artifact of the grid. It does not appear at higher resolution or in the strong-field disk (at either resolution), suggesting that the instability is caused by a complex interplay of magnetic field strength and resolution.
For full details, see Rodman, P.E., Reynolds C.S. (2024) ApJ. 960:97